Most of us treat “incubator air” (~18–21% O₂ with 5% CO₂) as a stand-in for normoxia. But oxygen must diffuse from the air–liquid interface down through millimeters of static medium to reach cells. That diffusion barrier—combined with cellular oxygen consumption—means pericellular O₂ can be far lower than you think. In many standard setups, cells at the bottom experience mild, chronic hypoxia even when the incubator is set to ambient O₂.
This is not rare edge-case behavior; it’s a predictable outcome of physics and cell metabolism. And it has real consequences for data interpretation, cross-lab reproducibility, and translation.
How routine setups create lower-oxygen microenvironments
- Medium depth & volume: A 2–3 mm column of medium is a long diffusion path. If cell oxygen consumption outpaces diffusion, O₂ at the monolayer can drop dramatically. Deeper media → steeper gradients.
- Cell density & metabolic demand: High densities and oxidative cell types (adipocytes, myotubes, hepatocytes, cardiomyocytes) consume O₂ quickly, pushing local environments into hypoxia.
- Vessel geometry & gas exchange: Tall flasks, tight lids, small air-exchange areas, and stagnant headspace limit replenishment. Standard plastic admits some O₂, but not enough to offset thick media and heavy consumption.
- Incubator routines: Door openings, plate stacking, time on the bench, long unshaken incubations, and “set-and-forget” long treatments can let O₂ drift.
Bottom line: “21% O₂ in the incubator” ≠ “21% O₂ at the cell.” Even modest changes in media height or density can swing cells from physioxia to significant hypoxia.
What cells do under mild, unintentional hypoxia
- HIF stabilization & gene programs: HIF-1α/2α partially stabilize, nudging transcription toward hypoxia-responsive genes (e.g., GLUT1, glycolytic enzymes, CA9, VEGF).
- Metabolic shift (Warburg-like): Cells increase glycolysis and lactate production and reduce oxidative metabolism—not because they “prefer” it, but because O₂ is limiting.
- Phenotypic drift: Slower proliferation, changes in differentiation status (often more stem-like or quiescent), altered cytokine/angiogenic factor secretion, and stress-response activation (UPR/ER stress, mTOR changes).
- Redox effects: Oxygen fluctuations and re-oxygenation events can modulate ROS, influencing signaling and potential DNA damage responses.
These adaptations are often subtle. Cultures look fine, viability is acceptable—yet the biology you’re measuring has shifted.
Where this bites hardest (and why reproducibility suffers)
- O₂-hungry models: Adipocytes, muscle, hepatocytes, cardiomyocytes, brown adipose—anything with high oxidative demand is susceptible.
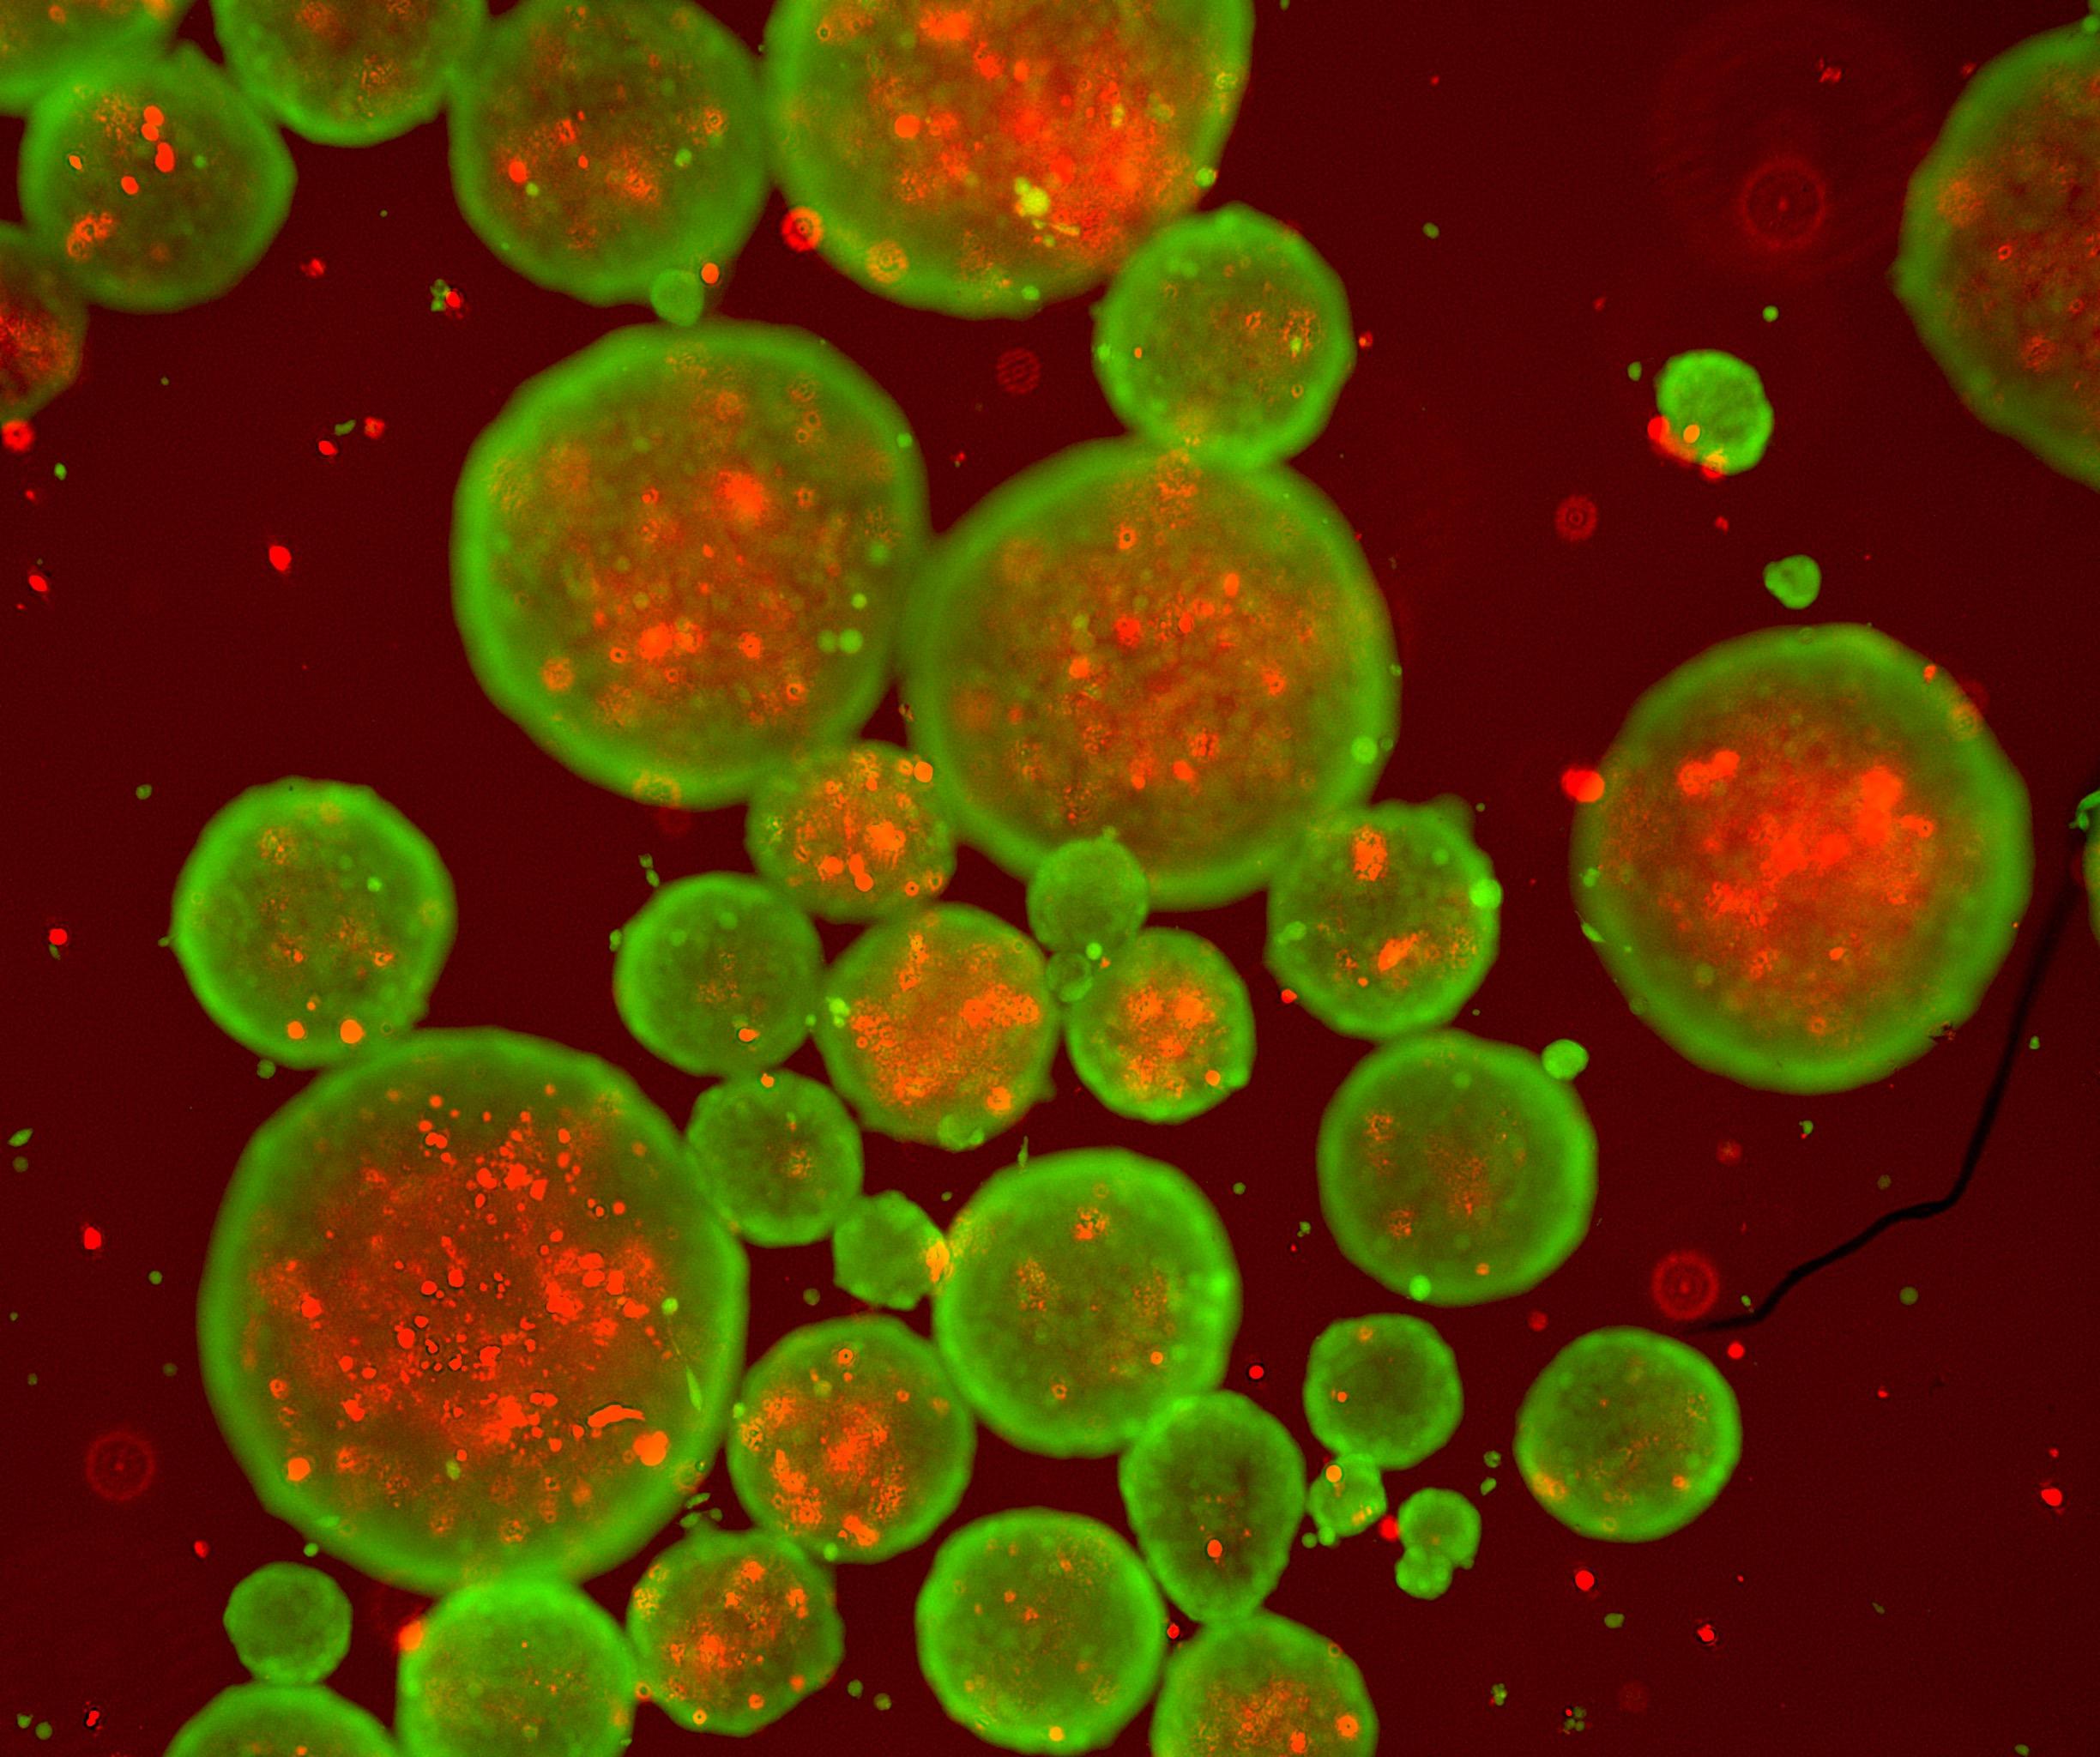
- 3D systems: Spheroids and organoids naturally form internal gradients; modest size differences can flip cores from viable to hypoxic/necrotic.
- High-density monolayers or multilayers: Confluent sheets and stratified epithelia develop sharp O₂ drops across the thickness.
- Large volumes & static conditions: Long incubations with deep medium, sealed or minimally ventilated vessels, and no mixing exacerbate O₂ limitation.
- “Physioxia” experiments (e.g., 5% O₂) without diffusion control: If media are deep, pericellular O₂ can land well below the intended setpoint.
Reproducibility risk: Two labs can run “the same” protocol under “normoxia” yet expose cells to very different pericellular O₂. That changes drug responses, signaling readouts, and transcriptomes—fueling conflicting results.
How to see the problem (without overhauling your lab)
You don’t need sensors in every dish to benefit:
- Quick diagnostics
- Check HIF-1α or canonical targets (GLUT1, CA9, VEGF) under your “normoxic” conditions.
- Use hypoxia reporters (e.g., pimonidazole, fluorescent probes) in a pilot plate.
- Compare readouts after reducing media depth—do lactate production, growth rate, or key markers shift promptly? If yes, O₂ was limiting.
- Back-of-the-envelope modeling
- Estimate pericellular O₂ from media height, well geometry, cell density, and approximate OCR from literature. Even coarse estimates flag when you’re likely oxygen-limited.
- Targeted measurement (when it counts)
- For pivotal assays, consider oxygen sensor spots/plates or OCR tools. A single instrumented well alongside your experimental set can reveal whether O₂ is collapsing during the assay window.
For the full White Paper Contact Us
Read more about Mitigation Strategies